DM Speech vs. DTMF
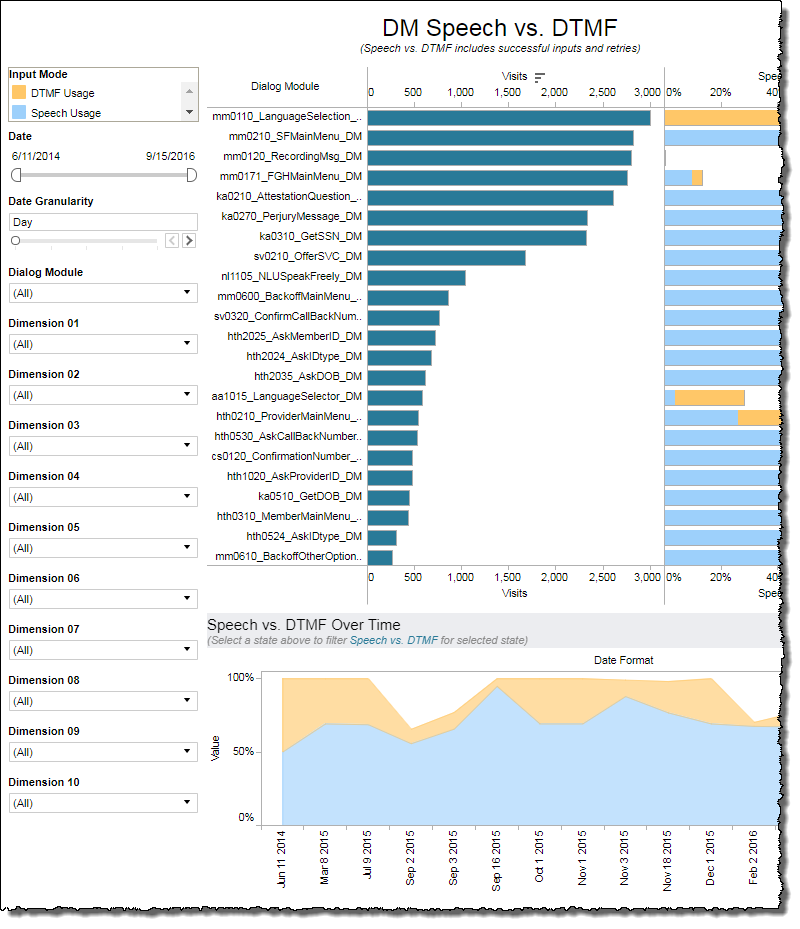
The DM Speech vs DTMF report displays a percentage distribution of input modes for each Dialog Module (DTMF or speech).
Note: This report is applicable only for clients using the IVR channel.
The percentages are calculated from the total number of inputs the Dialog Module processed, including both inputs that resulted in a retry and inputs that resulted in a successful exit with intent. On the left hand side of the report there are options to filter by date ranges, call outcomes, exit reasons and by a variety of other dimension defined by AFOs![]() An AFO, or after-the-fact-outcome definition, is an XML file that contains conditions used by NI when interpreting a log file to define call outcomes, call exit reasons, and variables used for filtering calls and for reporting on Key Performance Indicators.. In addition, there is an option to choose to only look at specific Dialog Module states.
An AFO, or after-the-fact-outcome definition, is an XML file that contains conditions used by NI when interpreting a log file to define call outcomes, call exit reasons, and variables used for filtering calls and for reporting on Key Performance Indicators.. In addition, there is an option to choose to only look at specific Dialog Module states.
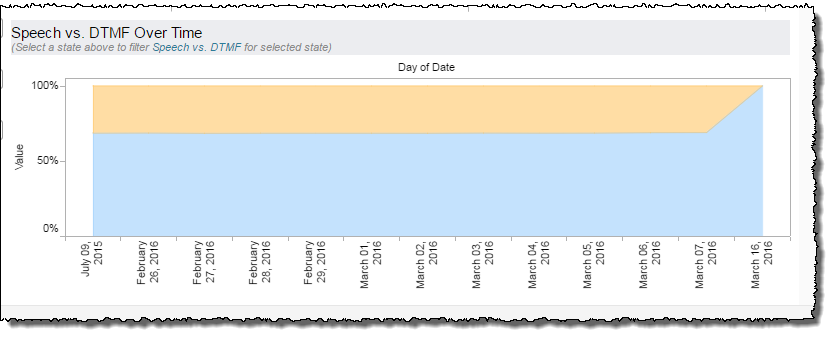
The Speech vs. DTMF Over Time graph shows the combined percentages of Speech and DTMF input for all Dialog modules. Clicking on the name of a Dialog Module in the top graph will cause the Speech vs. DTMF Over time graph to trend only the inputs from that specific Dialog Module.
Visualizations
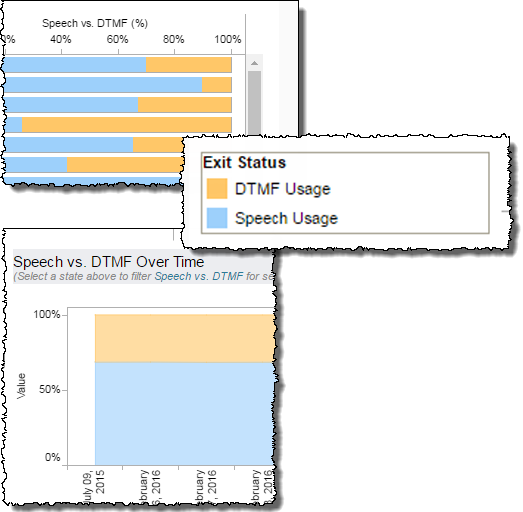
Exit Status legend
This legend describes the color-coding scheme used on the Speech vs. DTMF side of the top graph as well as the Speech vs. DTMF over Time graph to distinguish usage modes of Dialog Modules from one another.
Top graph
This report shows a percentage distribution of input modes for each Dialog Module (DTMF or speech). The percentages are calculated out of the total of inputs the Dialog Module Processed, including both inputs that resulted in a retry and inputs that resulted in a successful exit with intent.
This graph has two components. The Visits (left-most) side of the chart is a simple numerical count of executions of individual Dialog Modules. Each row of the graph corresponds to a single Dialog Module. The Speech vs. DTMF (right-most) side of the chart breaks down each Dialog Module's group of visits into a visualization of the relative volume of each input mode to the overall whole.
- Visits - Raw count of the number of executions of a particular Dialog Module.
- Speech Usage - Percentage of inputs to the Dialog Module that were via speech input. This is determined by dividing the number of speech inputs by the total number of inputs.
- DTMF Usage - Percentage of inputs to the Dialog module that were via DTMF input. This is determined by dividing the number of DTMF inputs by the total number of inputs.
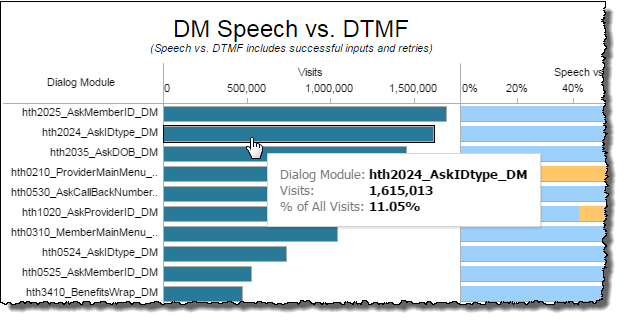
On the Visits side of the graph, hovering over any bar:
- Identifies the Dialog Module
- Expresses the relative contribution of the Dialog Module's visits in comparison to the aggregate of all Dialog Modules (expressed as a percentage).
- Quantifies the number of visits for the Dialog Module
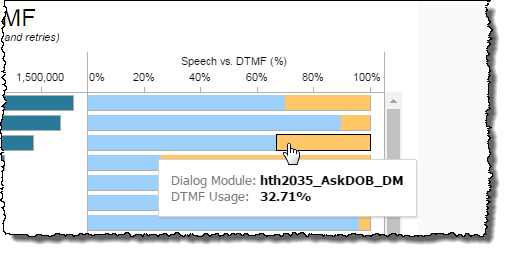
On the Speech vs. DTMF side of the graph, hovering over any color-coded section of any bar:
- Identifies the Dialog Module
- Expresses the relative contribution (a percentage of the overall contribution of all visits of this Dialog Module yielding a result) of the mode you are hovering over
Bottom graph
This shows the Speech Usage and DTMF Usage percentages from the top graph trended over time. Selecting a single Dialog Module the top graph causes this graph to show percentages only for that Dialog Module
Filters
Increase the specificity of your report by applying filters to the data. The DM Speech vs. DTMF report's filters include Date and Dialog Module. Additionally, the report may include one or more other customized filters depending on what has been configured specifically for your system.
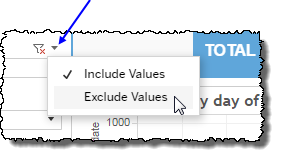
Clicking Include values displays only those data possessing the selected values. All other data are hidden from the visualization.
By contrast, clicking Exclude values displays only those data that do not possess the selected values.
Date
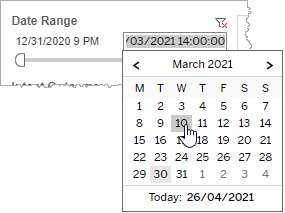
The Date Range filter is a slider with two moveable sides. By narrowing the date range, you display only data falling within the range.
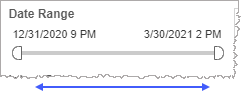
In addition to the slider, the filter allows you to specify start and end points to the range by time of day as well as by date by clicking the Start and End regions, clicking a second time on the time of day, and then manually entering a new time of day.
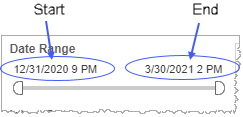
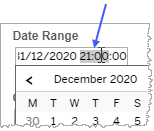
To select a date with the date picker, click the Start region to pick a date from the date picker widget. Do the same with the End region.
Dialog Module
Reduce the volume of reported data by specifying which Dialog Modules to include (to the exclusion of all other unselected Dialog Modules).
-
Click the Dialog Module field to see the drop-down list.
-
Select a Dialog Module from the list.
Custom filters
This report accommodates customizable filters.
Customizable filters narrow the scope of the reported dataset by including or excluding data with identifiable attributes. These attributes may be about the caller, the call itself, or about an event that may have happened during the call.
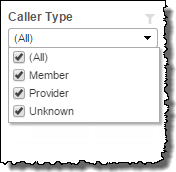
For example, one possible customizable filter you can add and customize in this view is Caller Type, in which you can narrow the reported data to include, or exclude, only those data with the selected caller type.
For more information about how to add customized filters to your view, contact your Nuance Professional Services representative.
Note: If you would like to modify this or any report, Nuance Communications, Inc. recommends you contact Nuance Professional Services.
